What to Look for in Enterprise Risk Management Software
Enterprise risk management software replaces static spreadsheets and email chains by aligning risk data, controls, and decision-making in one integrated platform. Enterprise Risk Management Software connects organization-wide oversight with process-level detail so organizations can identify, assess, and manage risks with clarity and consistency. This not only creates a standard organizational response to risk management it removes silos and gives teams the structure to set risk appetite, select the right controls, and monitor performance in real time. The result is a more agile, transparent, and proactive risk management process that drives both accountability and confidence across the organization.
Mitigating risk is top-of-mind for organizations seeking to thrive in an “always on”, highly digitized world. Nearly one in two global business leaders say their organizations recently experienced a large, unplanned risk event.
What’s enterprise risk management? Why centralize it?
Enterprise risk management (ERM) identifies, assesses, and mitigates risks across the organization. Centralizing ERM within a software platform strengthens decision-making and resilience by unifying risk information and the organizations’ corresponding responses . With everything in one place, you can see risks in context, assign ownership, measure impact and likelihood with a consistent matrix, as well as track whether controls and plans are working. Centralization also supports collaboration across the organization using permissions-based access that increases adoption and data quality.
What’s operational risk management and how does it fit?
Operational risk management reduces exposures that come from processes, systems, people, and external events. It’s actually tightly connected to ERM. Instead of treating operational risk in isolation, a modern platform connects it to the bigger picture. This way, patterns and trends are visible before they escalate. Losses, incidents, near misses, and control performance are captured and linked to relevant risks and actions. This transparency strengthens resilience for internal and external stakeholders and keeps treatments aligned to appetite.
How does the platform define risk appetite and what controls you need?
Effective programs start with a clear statement of how much risk your organization is willing to accept. The software helps you establish risk appetite and identify the controls you need to manage, monitor, and report on risk. You determine risk tolerance and calculate current levels using a consistent scoring matrix. Standardized impact and likelihood scales make results comparable across departments. That consistency unlocks automation, alerts, and reliable reporting.
How should I build a risk inventory that reflects my business’ unique needs?
A risk inventory is a structured, organized list of all the risks an organization faces or could face. Enterprise Risk Management software supports flexible ways to create a digital risk inventory. It can be organized by business processes like sales, human resources, and operations, and by strategic objectives like revenue growth or productivity, or by a combined view. This flexibility allows you to map risk according to the way work gets done within your organization, while maintaining an enterprise structure. The result is an inventory that is understandable, traceable, and ready for assessment and continuous improvement.
A unified risk register centralizes every identified risk in a dynamic, continuously updated repository. The risk register tracks ownership, status, and treatment across the enterprise and links risks to controls, incidents, indicators, and action plans. This single source of truth eliminates competing versions and keeps everyone aligned. It also simplifies executive and board reporting because results roll up cleanly from the same dataset that teams use every day. When audit time arrives, the risk register provides version history, evidence, and traceability; and in daily operations, a visible risk register helps owners manage actions to closure.
Which components should ERM software include?
Effective ERM software should feature specific components. Ones that reflect how risk moves through your organization. In Enterprise Risk Manager, the module includes Control, Key Risk Indicator, Objective, Process, Process Group, Risk, and Risk Area. These components connect so you can see how objectives drive processes, how processes group into larger activities, which risks and risk areas they touch, which controls mitigate them, and which indicators monitor performance. The structure turns scattered data into a workable model.
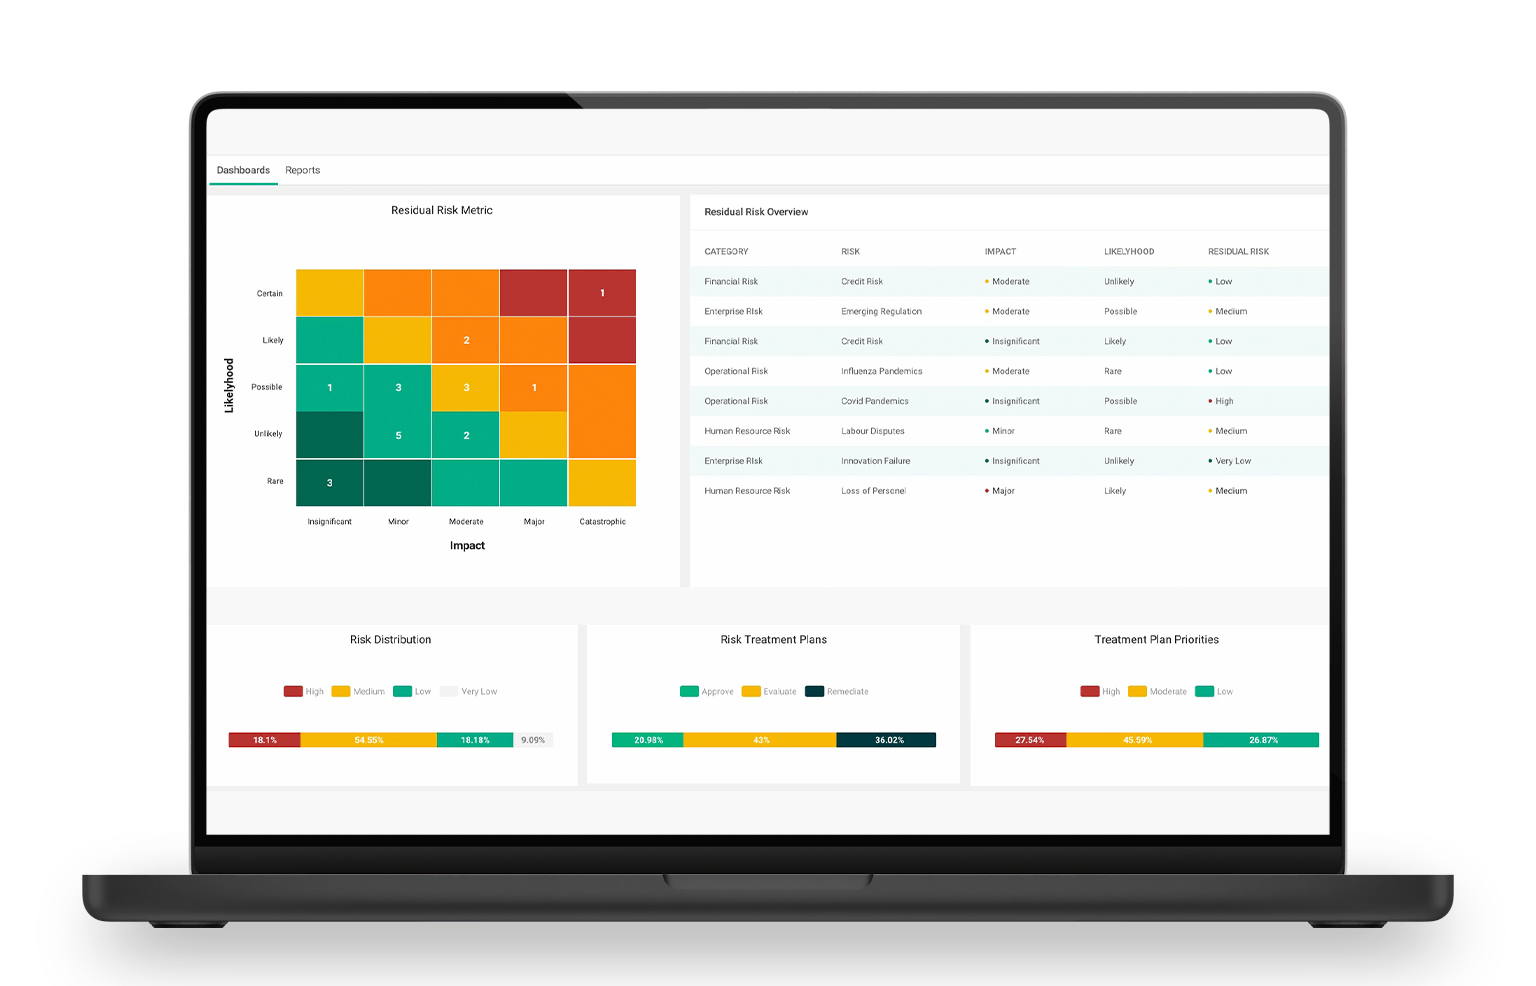
What’s a 360° risk dashboard and why does it matter?
A 360° risk dashboard gives real-time visibility through intuitive, role-based views. Decision-makers can spot patterns, drill into indicators, and verify ownership and status without leaving the page. The best risk dashboard consolidates information into a unified, accurate profile. This replaces static spreadsheets with live insight and shortens the path from signal to action while encouraging adoption because users see what is relevant to them.
A well-implemented risk dashboard also reinforces accountability by surfacing owners, due dates, and progress. A risk dashboard approach aligns executive and operational views into one place.
Can I track risks in real time and receive early warnings?
Yes. Interactive dashboards and automated alerts provide real-time insight into enterprise and operational risk. Alerts are triggered from key risk indicators, assessment changes, and control failures. You define thresholds and routing, so notifications go to the right people and escalate quickly. Continuous monitoring reduces lag between detection and action, prevents small issues from becoming incidents, and builds confidence in program readiness.
How do assessments and scoring improve scalable decisions?
Standardized assessments use impact and likelihood scales, so scores are consistent and comparable. This way you can rank risks, watch trends, and automate actions based on thresholds. It also supports quantification.
What does quantification mean? Because scoring is consistent, results are comparable across teams and time. This way, you can rank risks, spot trends, trigger thresholds, and run scenario modeling with unified data. It’s about going beyond static reporting to more dynamic analytics.
When inputs are consistent, simulations and analytics can translate risk into understandable exposure ranges. Consistency is the thread that ties visibility, automation, and reporting together across the organization. What does quantification mean? Because scoring is consistent, results are comparable across teams and time—so you can rank risks, spot trends, trigger thresholds, and run scenario modeling with unified data, moving beyond static reporting to more dynamic analytics.
What’s value-at-risk simulation and when is it useful?
Value-at-risk simulations based on Monte Carlo modeling translate scenario ranges into potential financial exposure. This helps leaders compare treatment options and prioritize controls based on expected effect. When results appear alongside live indicators and action status, leadership can move from headline metrics to detailed evidence in the same view. Quantification does not replace judgment, but gives decision-makers comparable context for investment.
How does loss and incident management reduce operational surprises?
Loss and incident management captures operational losses, incidents, and near misses in one place. It documents facts, investigations, and root causes, and links events to affected risks and controls so weak points are visible. Centralizing this record speeds corrective action and prevents repeat issues. When an event crosses a defined threshold, the platform can trigger the relevant continuity plan and coordinate response tasks without manual handoffs.
How should ERM software support recognized standards and frameworks?
ERM software should align with frameworks such as COSO, ISO 31000, ORX, and Basel II/III. These standards provide a shared language for taxonomy, assessment structure, and control mapping. Alignment makes audits and regulatory reviews more efficient and ensures outputs are easy for stakeholders to interpret. At the same time, the system must be configurable. You should be able to adapt taxonomies, scoring, and reporting to match industry, regional, and business-unit needs.
What role do workflows and automation play in consistency?
Workflows and automation make processes predictable and measurable. Reviews, edits, approvals, and distribution follow defined steps with version control and assignment. Automated reminders keep timelines on track. Escalations happen before due dates. In practice, this reduces manual effort and error. It also clarifies accountability because each task has an owner and a visible status. Standardizing incidents, action plans, and control assessments ensures that motion translates into results.
What does executive risk reporting look like in practice?
Executive risk reporting turns program activity into clear insights for leadership and the board. Reports show live metrics on program health, where risk is rising or falling, which actions are on track, and where gaps remain. Outputs are board ready and align with the frameworks your organization uses. Because reporting draws from the unified repository, leaders can move from summary to detail without switching systems, which supports timely, confident decisions.
How should enterprise risk connect to IT risk?
Enterprise and technology exposure should reinforce each other rather than operate in parallel. The platform should connect cybersecurity, data, and infrastructure risk to enterprise oversight. It should leverage frameworks such as NIST for technology domains. Asset-based assessments should link to controls and incidents. Integration with configuration management data reduces manual work. When both teams see the same picture, governance improves and action accelerates. Enterprise Risk Management Software helps bridge this gap by aligning IT-specific signals to enterprise-level scoring and workflows.
How do real-time indicators and alerts keep programs proactive?
Key risk indicators monitor conditions that matter to your business. When indicators cross thresholds or a control fails, automated alerts trigger and route to owners. This provides early warnings and a clear next step. Because the platform tracks ownership, status, and deadlines, you can see whether issues are moving and where support is needed. Proactive programs rely on these signals to prevent escalation and confirm that treatments are effective.
How does a single source of truth break down silos?
Silos hide risk. A single source of truth brings risks, controls, assessments, indicators, incidents, and action plans together. It ties third-party data and technology exposure to the same model. It powers dashboards, alerts, simulations, and reports with one dataset. This eliminates rework and reduces confusion about which version is correct. It also encourages participation because users can contribute through collaborative, intuitive interfaces that reflect their roles. Enterprise Risk Management Software makes this single-source approach practical by unifying the data that teams rely on every day.
What outcomes should I expect from an integrated ERM solution?
Expect comprehensive visibility, decisions backed by data, and operational agility at scale. You can see risk in context through a 360° view, consolidate data into a unified profile, and engage lines of defense with collaborative interfaces. You can use standardized impact and likelihood scales, trigger alerts from indicators and control failures, align to frameworks like COSO, automate workflows for incidents, action plans, and control assessments, integrate third-party information for broader visibility, and connect technology domains to enterprise oversight. Enterprise Risk Management Software should also support flexible inventories, clear ownership, and evidence trails that satisfy audits and reviews.
How does the software support a high-level process?
A clear process keeps momentum. At a high level, organizations can follow four steps to manage posture.
- Plan by identifying the type of risk to assess, the targets of the assessment, and the people to involve. Such as selecting processes, process groups, objectives, risk areas, and key risk indicators.
- Evaluate by sending the assessment to the business owner to score the risk with the consistent matrix.
- Review by having the risk officer examine results against appetite and determine whether a correction plan is needed.
- Complete by incorporating findings into the overall posture or, when required, launching and tracking a correction plan through defined workflows that document ownership, status, and outcomes. Enterprise Risk Management Software supports each stage with intuitive forms, routing, and version histories.
How do related modules strengthen enterprise risk?
Enterprise risk does not stand alone. Related areas include technology domains, third-party oversight, internal controls, and horizon scanning. Technology risk capabilities should leverage recognized frameworks, link assets to controls and incidents, and reduce manual work with integrations. Third-party oversight should centralize partner profiles, contracts, screening, due diligence, reassessments, reminders, and approvals. Internal controls should align with your frameworks and show how they mitigate identified risks. When these areas connect, the enterprise view becomes complete and actions move faster. Enterprise Risk Management Software helps maintain that connection by keeping assessments, indicators, incidents, and actions in one place.
Final Thoughts
The evolving environment calls for an integrated strategy built on transparency, fit-for-purpose technology, and smarter frameworks. It’s about aligning risk data, controls, and decisions in one solution. This helps set appetite, determine the controls you need, and monitor performance with live indicators. It gives you a flexible inventory organized by processes and strategic objectives. It provides a unified repository, real-time views, continuous alerts, and executive-ready reporting so teams can prove effectiveness and make improvements visible.
That is the promise of a consistent platform, where operational risk management and enterprise oversight operate from the same facts, supported by automation that keeps work moving and by reporting that shows what changed, why it changed, and what happens next. And with the core record of risks, owners, and actions always current, your program’s risk register stays authoritative and useful across the full cycle.